
-
1. Introduction
- 1.1 About ZenTao
- 1.2 Introduction PDF
- 1.3 Technical Support
- 1.4 Follow Us
-
2. Installation
- 2.1 Choose the Right Installation
- 2.2 ZenTao Cloud
- 2.3 One-click Installation for Windows
- 2.4 One-click Installation for Linux
- 2.5 Lampp Installation in Linux
- 2.6 Source Code Installation (for all systems)
- 2.7 Source Code Installation for macOS
- 2.8 XAMPP-VM Installation for macOS
- 2.9 XAMPP Installation for macOS
- 2.10 Install ZenTao in Docker
- 2.11 Install httpd, Mariadb, PHP 7.2 in Cent OS 8
- 2.12 Softaculous Service
- 2.13 Install Ioncube
- 3. Update
-
4. Users and Groups
- 4.1 Company Structure
- 4.2 Add a User
- 4.3 Manage Users in batches
- 4.4 Groups and Privileges
-
5. Quick Start
- 5.1 Project and Task Management
- 5.2 Bug Tracking
- 5.3 Product Management
- 5.4 Todo Management
-
6. Basic Application
- 6.1 Basic Workflow
- 6.2 Agile and Scrum
- 6.3 ZenTao and Scrum
- 6.4 ZenTao Tutorial for Rookies
- 6.5 Create a Product
- 6.6 Create a Story
- 6.7 Create a Project
- 6.8 Confirm a Story
- 6.9 Decompose Stories into Tasks
- 6.10 Report a Bug
- 6.11 Manage Contacts
- 6.12 Customization
- 6.13 Import Excel, CSV Files
- 6.14 Document Management
- 6.15 Work Mode
- 6.16 Points
- 6.17 Required Field
- 6.18 Privileges
- 6.19 Annual Work Summary
-
7. Advanced Application
-
7.1. Workflow
- 7.1.1 ZenTao Workflow
-
7.2. Individual management
- 7.2.1 My Todo
- 7.2.2 My Task, Story and Bug
- 7.2.3 My Profile
-
7.3. Product Owner
- 7.3.1 Manage a Product
- 7.3.2 Manage a Product Line
- 7.3.3 Create and Review a Story
- 7.3.4 Change and Review a Story
- 7.3.5 Status and Phase
- 7.3.6 Story Writing
- 7.3.7 Product Module
- 7.3.8 Release Plan
- 7.3.9 Create a Release
- 7.3.10 Roadmap
- 7.3.11 Documents
- 7.3.12 Planning Meetings
- 7.3.13 Daily Scrum, Review and Retrospective Meetings
- 7.3.14 Story Reports
-
7.4. Scrum Master
- 7.4.1 Create a Sprint
- 7.4.2 Set a Team
- 7.4.3 Confirm a Story
- 7.4.4 Task Breakdown
- 7.4.5 Daily Standup Meetings
- 7.4.6 Check Project Progress via Burndown Chart
- 7.4.7 Check Project Progress via Lists
- 7.4.8 Review and Retrospective Meetings
- 7.4.9 Basic reports on tasks
-
7.5. Development Team
- 7.5.1 Project planning meeting and task breakdown
- 7.5.2 Claim tasks and update efforts
- 7.5.3 Kanban and Tree Diagram
- 7.5.4 Build
- 7.5.5 Test Request
- 7.5.6 Resolve a Bug
- 7.5.7 Documents
- 7.5.8 Confirm Bugs
-
7.6. Test Team
- 7.6.1 Bug Tracking
- 7.6.2 Report a Bug
- 7.6.3 Verify and Close a Bug
- 7.6.4 Activate a Bug
- 7.6.5 Find a Bug
- 7.6.6 Test Case
- 7.6.7 Create and Review Test Cases
- 7.6.8 Test Suites, Public Case Libs and Reports
- 7.6.9 Manage Test Requests
- 7.6.10 Run Cases and Report Bugs
- 7.6.11 Reports
-
7.1. Workflow
-
8. Configuration
-
8.1. Maintain ZenTao
- 8.1.1 Initialize scripts
- 8.1.2 Data Backup
- 8.1.3 Recover the Deleted
- 8.1.4 Update Burndown Charts
- 8.1.5 ZenTao Remote Host
-
8.2. Deploy ZenTao
- 8.2.1 Guest Login
- 8.2.2 Email Notification
- 8.2.3 Set Super Admin
- 8.2.4 Static Access
- 8.2.5 Remove "zentao" from URL
- 8.2.6 Integrate SVN
- 8.2.7 Integrate Git
- 8.2.8 Integrate Webhook
- 8.2.9 Integrate Xuan.im
- 8.2.10 Integrate Zdoo
- 8.2.11 Integrate Third-Party Apps
- 8.2.12 Password-Free Login
- 8.2.13 Translation Add-on
- 8.2.14 Integrate Jenkins
- 8.2.15 Extension
- 8.2.16 Fix Weak Password
-
8.1. Maintain ZenTao
-
9. Customization
- 9.1 Introduction
- 9.2 Directory
- 9.3 Find Codes
- 9.4 Database Structure
- 9.5 Common Modules
- 9.6 Add Features to Menu
- 9.7 Set Privileges to Modules
- 9.8 Examples: modify language prompt
- 9.9 Examples: set priority when creating bugs
- 9.10 Extension Editor
- 9.11 Feature Limitation
- 9.12 ZenTao Packaging Standards 1.1
-
10. Misc
- 10.1 About Third-Party Code
- 10.2 Support ZenTao
- 10.3 ZenTao Service
- 10.4 Acknowledgement
Check Project Progress via Burndown Chart
- 2015-09-11 13:30:12
- azalea
- 10769
- Last edited by philip on 2021-12-08 13:44:25
- Share links
Except for coding and standup meetings, the DEV team should have to update the task status and estimate the man-hour left of the tasks that they are in charge of. ZenTao will generate a Burndown chart according to the overall man-hour left of all the tasks. Now, let’s look at an example.
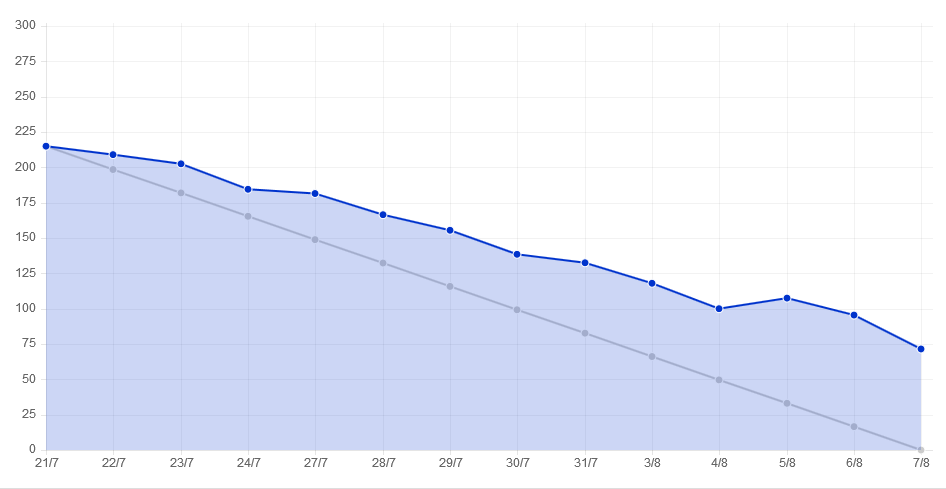
- The horizontal axis shows the dates and the vertical axis man hours.
- Man hours are the overall remaining man-hours of the tasks in the project. The man hours are calculated every day and then generate the coordinates, and then the Burndown Chart.
- Weekend can be hidden in burndown charts.
- In order to update the Burndown chart, you need to set scheduled tasks. Please refer to How to Update a Burndown Chart.
The difference between Burndown chart and Gantt chart
The core management philosophy of ZenTao is based on Scrum, so its main tool is Burndown chart instead of Gantt chart, which also represents two distinct management ideas. Gantt chart is management by controlling which is done by setting a start and end time and positions strictly; Burndown chart is more about the remaining hours of the project. So in ZenTao, we do hope that you can make full use of the Burndown chart.

Write a Comment
Products
- ZDOO
- ZDOO Cloud
Support
- Request Demo
- Tech Forum
- GitHub
- SourceForge
About Us
- Company
- Private Policy
- Blogs
- Partners
Contact Us
- Google Groups
- Leave a Message
- Email: philip@easycorp.ltd
- Skype: philip517


